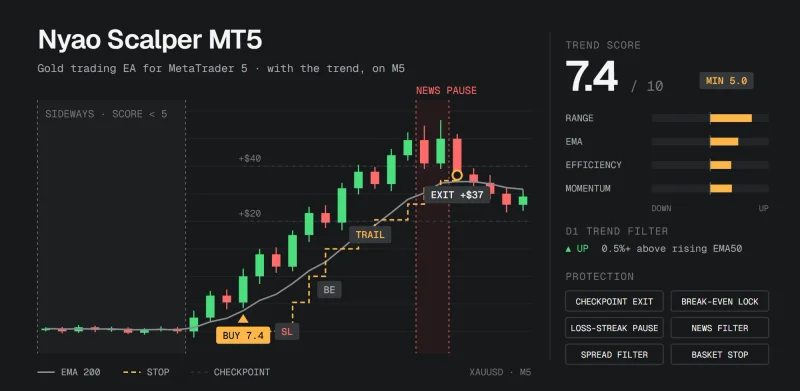
Nyao Straddle: a gold EA that only trades extreme volatility
My second open source MetaTrader 5 EA waits for gold's most extreme hours, then trades $1 breakouts in both directions. How it works, the crash that made most of its profit, a coin flip test, and why it only works on gold.
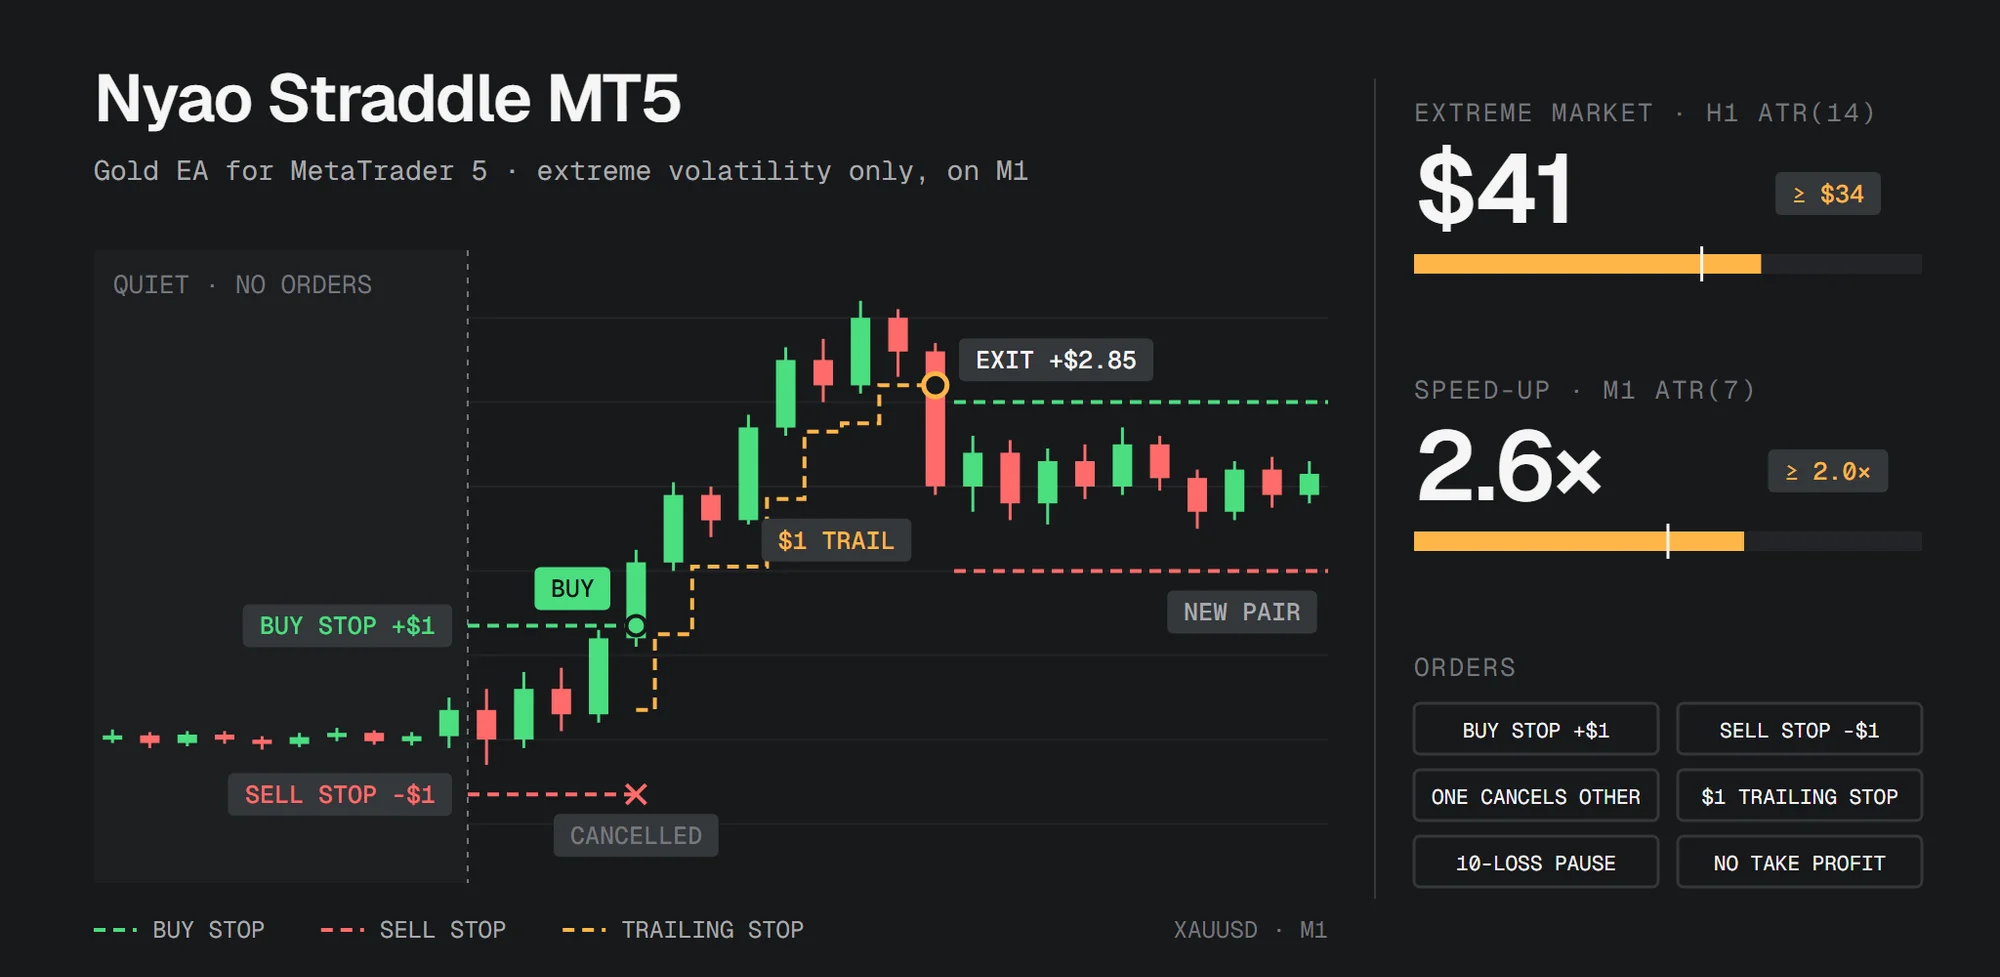
Nyao Straddle is my second open source Expert Advisor (EA) for MetaTrader 5, and it works almost the opposite way to Nyao Scalper. Nyao Scalper trades gold with the daily trend and makes its money in steady trends. Nyao Straddle ignores the trend. It waits, often for weeks, until gold becomes extremely volatile. Then it places a buy stop and a sell stop $1 either side of the price, and lets whichever one fills run behind a $1 trailing stop.
- Source code: nyao_straddle.mq5 on GitHub, in the same repository as Nyao Scalper
- Backtest reports: 2026, real ticks, plus 2025 and 2022-2024 on generated ticks
Risk warning. Nyao Straddle is even more experimental than Nyao Scalper. Every result below comes from backtests in MetaTrader's Strategy Tester on a single year of real tick data, and most of the profit comes from one event. At most brokers, gold is traded as a CFD (contract for difference) with leverage, so a small price move becomes a large gain or loss, and most retail CFD accounts lose money. Past results don't predict future ones. Nothing in this post is financial advice: do your own research (DYOR), test on a demo account first, and never trade money you can't afford to lose.
The short version
| Result | |
|---|---|
| Strategy | A buy stop and a sell stop $1 from the price, only when gold is extremely volatile, on the 1-minute chart |
| Risk per trade | 0.01 lot: about $1 at the stop, plus slippage |
| Jan-Sep 2026, real ticks | +239.0% (each month from $2,000), profit factor 2.02, max drawdown 2.7% |
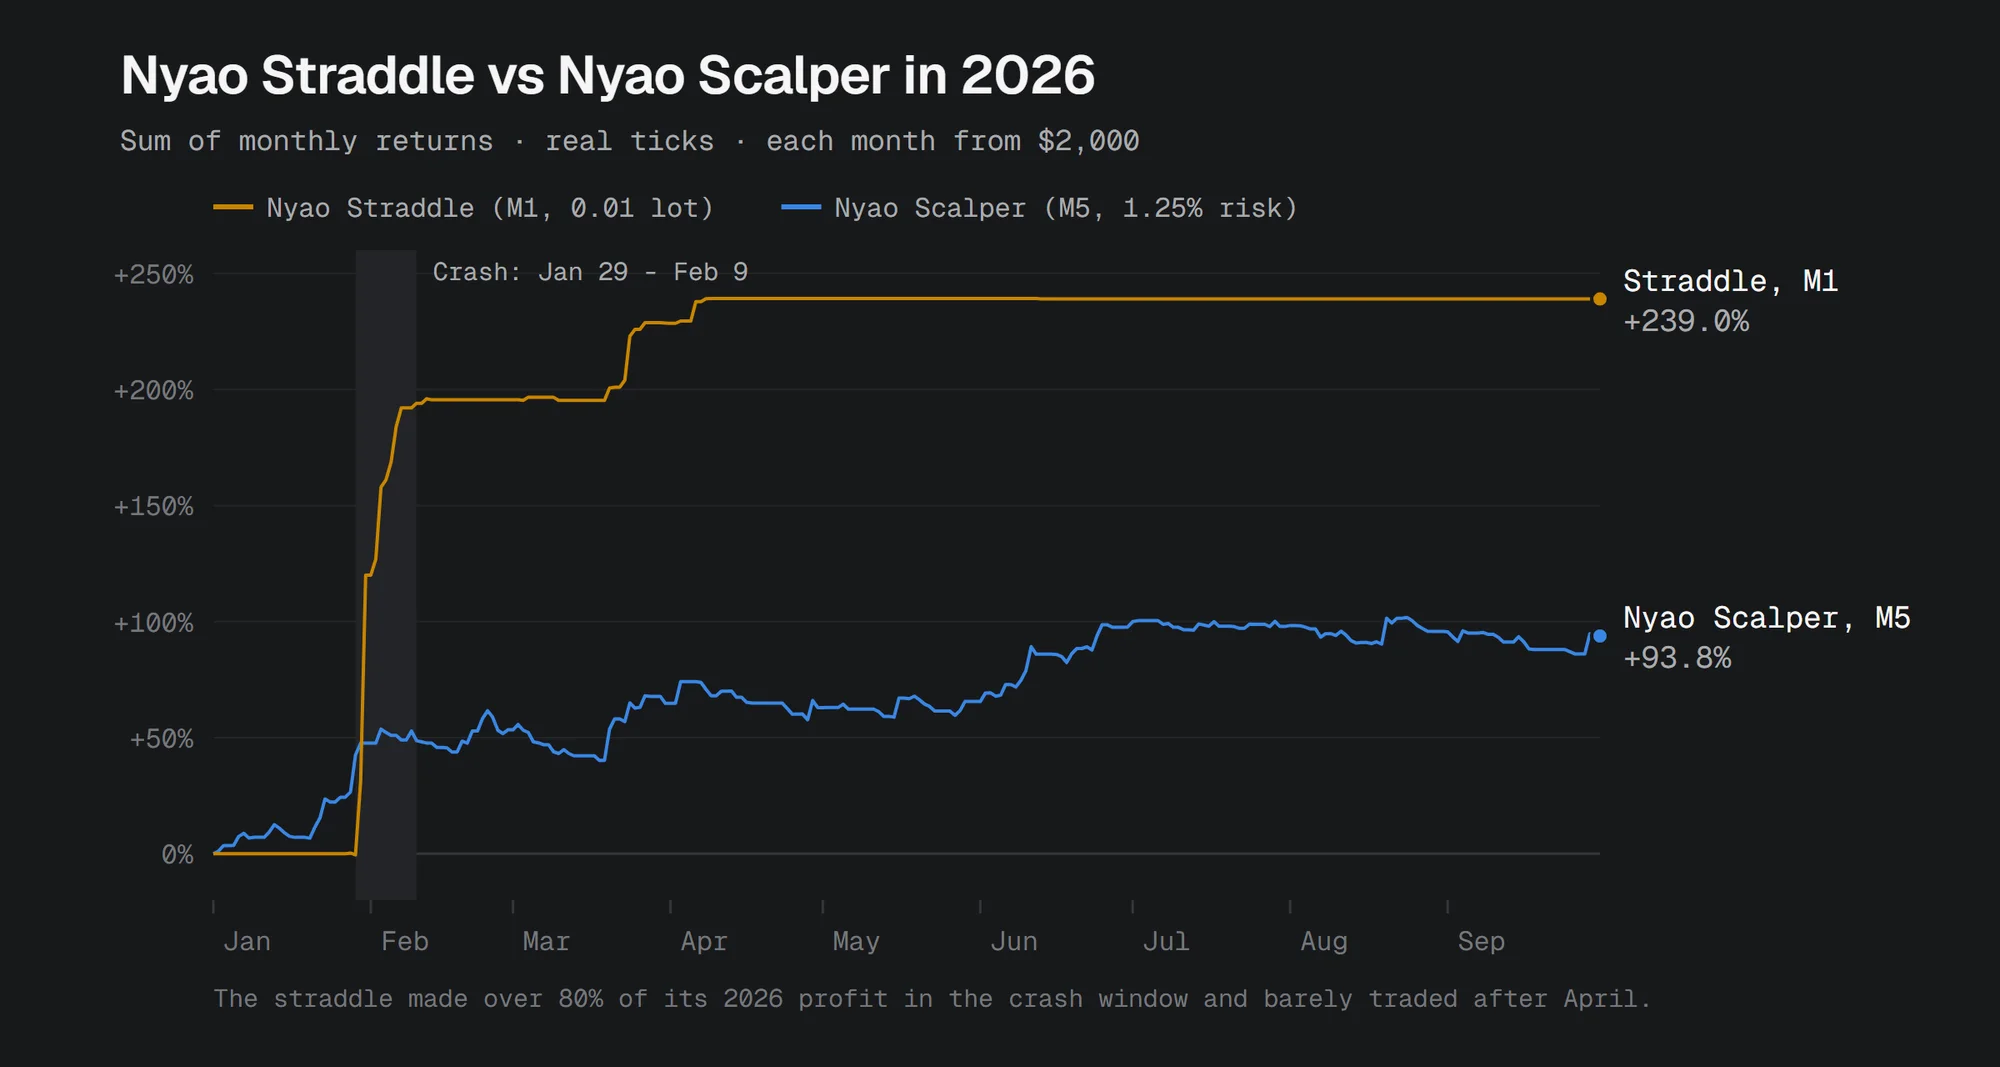
| Where the profit came from | Over 80% from one event: the gold crash of late January 2026 |
| Months with trades | 5 of 10 in 2026, none from July to October |
It looks great on paper, and most of this post is about why that number needs a lot of context.
How it works
- Extreme markets only. Gold's 1-hour ATR(14), the average range of the last 14 closed hourly bars, must be at least $34. That was gold's most extreme 10% of the time in 2026. From January to April it held for hours or days at a time; in May and from July to October it never happened.
- The market must be speeding up. The ATR of the last 7 one-minute bars must be at least twice its average over the last 288 bars, about five hours.
- A straddle. While both hold, the EA keeps a buy stop $1 above and a sell stop $1 below the price. The first one to fill cancels the other.
- The exit. The position starts with a $1 stop that trails $1 behind the price from the moment it fills. There's no take profit: the trailing stop ends every trade.
- Again. As soon as a position closes, a new pair goes out, as long as the market is still extreme. In a crash that means many trades an hour.
- A pause. After 10 losing trades in a row, it places nothing for 30 minutes.
Untriggered orders are deleted when the market calms down. The chart shows the current ATR values next to the levels they need, so you can always see why it is or isn't trading.
The straddle never predicts a direction. It enters only after price has already moved $1 one way, in a market where a $1 move tends to keep going, and the tight trailing stop cuts the trades where it didn't.
What the backtests say
All tests ran in MetaTrader 5's Strategy Tester on 2026 real ticks. Each month is a fresh run from $2,000 at 0.01 lot, so one month can't hide another, and totals are the sum of the monthly returns.
| Jan-Sep 2026 | M1 (the timeframe it was tuned on) | M5 |
|---|---|---|
| January | +120.0% | +109.7% |
| February | +75.5% | +27.7% |
| March | +33.0% | +45.5% |
| April | +10.7% | +1.5% |
| June | -0.2% | no trades |
| May, July-September | no trades | no trades |
| Total | +239.0% | +184.5% |
| Profit factor / max drawdown | 2.02 / 2.7% | 1.74 / 4.0% |
| Trades / win rate | 9,985 / 45% | 10,486 / 43% |
| Average win / loss (0.01 lot) | $2.12 / -$0.85 | $1.93 / -$0.84 |
October 2026, up to the 23rd, had no trades either. A few things put these numbers in context:
- One event made most of it. Over 80% of the profit came between January 29 and February 9, 2026: the crash and its aftermath. Outside that window the edge is a few cents per trade, about $0.09 per 0.01-lot trade.
- It sits idle most of the time. It traded in 5 of the 10 months of 2026.
- The tester fills orders instantly. It models slippage from real ticks (fills averaged about $0.10 worse than the order price), but not execution delay. In a crash the EA can trade every few seconds, and a real broker may fill later, requote, or limit that.
- The defaults were chosen on 2026 data, so there's no untouched period left to confirm them on.
Earlier years
The real ticks in my tester only go back to 2026. With ticks generated from 1-minute bars:
- 2022-2024: no trades. Gold was at about $1,600-2,800 then, and its hourly ATR never reached $34.
- 2025: only October traded, for +37.6% with an 83% win rate and a profit factor of 41.8. Generated price paths are far smoother than real ones, which makes a $1 trailing stop look almost perfect, so that number isn't usable.
A coin flip test
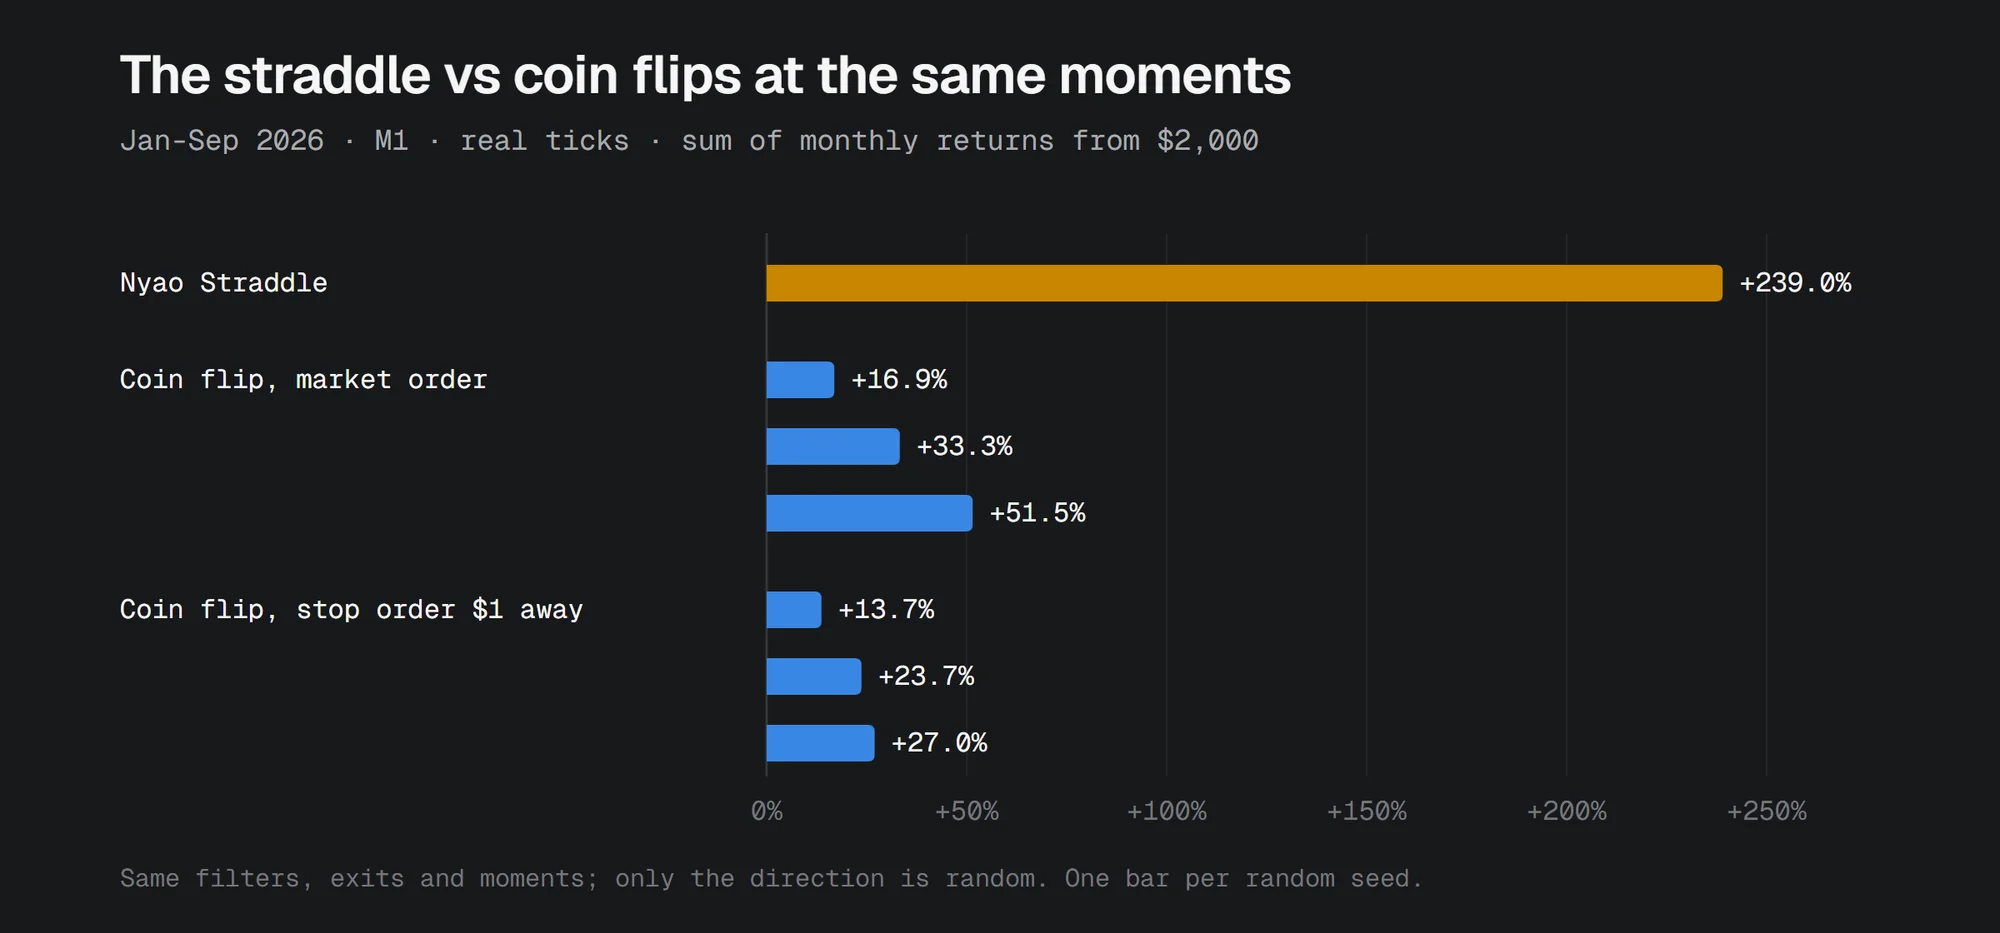
Does the straddle add anything, or would any trade at those moments have made money in a crash? As a control, the EA traded at exactly the same moments, with the same filters and exits, but a coin flip chose the direction. I tested two versions with three random seeds each, and wrote the pass rule down before running them: the straddle has to beat all six.
| Jan-Sep 2026, M1, $2,000 per month | Total | Profit factor | Max drawdown | Trades |
|---|---|---|---|---|
| Straddle | +239.0% | 2.02 | 2.7% | 9,985 |
| Coin flip, market order now (3 seeds) | +16.9% to +51.5% | 1.08-1.20 | 13-17% | 6,400-8,600 |
| Coin flip, one stop order $1 away (3 seeds) | +13.7% to +27.0% | 1.53-2.09 | 1-1.5% | about 1,030 |
The straddle beat all six. The comparison also shows where its edge comes from: entering only after price has already moved $1. A single random stop order earns about the same per trade as the straddle, because it also waits for a $1 move. Random market orders barely made money, and lost 13-16% in March. The straddle catches every breakout in either direction, so it gets about 10 times as many of those trades.
Why gold only
The straddle needs price to run well past its entry after paying the spread. On gold in 2026, a typical minute moved about 8 times the spread ($2.17 vs $0.26). On USDJPY, the market that works as a partner for Nyao Scalper, it moved only 1.8 times the spread (1.8 pips vs 1 pip).
| USDJPY, Jan-Oct 2026, M1, $2,000 per month | Total | Months up | Profit factor |
|---|---|---|---|
| $1 scaled by 1-minute volatility (a 0.83-pip stop, inside the 1-pip spread) | -165.2% | 0/10 | 0.06 |
| $1 scaled by daily volatility, like Nyao Scalper's USDJPY profile (a 3.9-pip stop) | -16.3% | 0/10 | 0.68 |
Both used USDJPY's own most extreme 10% (an H1 ATR of at least 0.303 yen) as the extreme-market level. Nyao Scalper works on USDJPY because its distances are wide, 78.6 pips. A $1-style straddle needs gold's large moves next to its cost.
Next to Nyao Scalper
The two EAs earned at different times in 2026: Nyao Scalper in steady trends (January, March and June), the straddle in the crash.
| Jan-Sep 2026, $2,000 per month | Nyao Scalper (M5) | Nyao Straddle (M1) | Both on one account |
|---|---|---|---|
| Total | +93.8% | +239.0% | +332.8% |
| Months up | 5/9 | 4/9 | 6/9 |
| Worst point within a month | -14.7% (March) | -0.8% | -14.8% (March) |
"Both" adds up the two monthly test runs, because the tester runs one EA at a time. The straddle added its profit without deepening Nyao Scalper's worst dip. An earlier version with a looser speed-up filter (1.5 times instead of 2) did deepen it: it lost in early March, at the same time as Nyao Scalper.
Every profile has its own magic number, so the straddle can share a hedging account with Nyao Scalper's gold and USDJPY profiles, each on its own chart. October 2026 isn't in the table: Nyao Scalper lost 6.5% and the straddle didn't trade.
How the defaults were found
The first version looked nothing like this one. It straddled whenever the M1 or M5 ATR reached 1.5 times its recent average, with stops in ATR multiples, at 0.50 lot. On M5, 8 of 9 months lost the whole $2,000. Fixed $1, $2 and $3 stops didn't save it: still 8 of 9 months drained, while February made a fortune, all of it in the week after the crash.
That February result was the clue. I compared each hour's profit with gold's 1-hour ATR at that hour: below $30, every level lost, and from $30 up, it won. Then I tested which volatility window picks out the good hours best: the M1, M15, H1 and D1 ATRs, each allowed only its most extreme 5, 10 or 20% of 2026. The minute windows lost outside the crash, and the daily one was too slow and caught only a third of it. H1 ATR(14) at its top 10%, about $34, was the only one that made money in all three periods outside the crash.
The other tests, each compared with the version current at the time (so rows aren't always comparable):
| Test | Result | Decision |
|---|---|---|
| Speed-up level of 1, 1.5 or 2 times normal | +674.9% / +400.1% / +207.2%, drawdown 20.2% / 7.3% / 1.9%. All of the extra profit at 1 time came from the crash | 2 times |
| Speed-up ATR over 5 to 60 minutes | Shorter was slightly better | 7 minutes |
| A $2 or $5 stop, with or without a profit lock | Lower profit every time. The $5 stop won 82% of its trades but took about 2,500 full $5.30 losses | $1 stop and trail |
| A break-even lock on the $1 stop | The gain was all in the crash, worse elsewhere | off |
| London and New York hours only | $7,972 vs $12,214 for all hours: Asian hours carried much of the crash | off |
| A spread cap | Spreads widen exactly when the market spikes, and low-spread trades did no better | off |
| One trade per candle | The same edge per trade, but 93% fewer trades and a fourteenth of the profit | removed |
| A 30-minute pause after 10 losses in a row | 22% less profit, half the drawdown, profit factor 1.63 → 1.81 | kept |
| A daily loss limit | No change to the worst drawdown, which builds over several days | rejected |
| 0.50, 0.05 or 0.01 lot on $2,000 | 0.50: most months lost the account. 0.05: March fell 80% before recovering. 0.01: no month dipped below -0.8% | 0.01 |
The lesson is the reverse of Nyao Scalper's. There, a wide stop lets the big trend trades run. Here, in a fast market, a tight stop that's hit often but costs little beat every wider one.
Account size
At 0.01 lot a trade risks about $1 plus slippage, or 0.05% of $2,000. That small risk per trade is why the drawdown stays so low. Bigger lots change the picture quickly: at 0.05 lot on $2,000, March fell 80% before it recovered.
On a cent account (balance in cents), 0.01 lot loses 1 cent at the stop. 0.05 lot, or RiskPercent 0.05, on a $100 cent account is about the same 0.05% per trade as 0.01 lot on $2,000. Cent gold spreads can be wider, though, and the straddle pays the spread on every trade. I haven't backtested a cent symbol.
What a demo test should check
- Fills in fast markets. The straddle earned about $0.48 per 0.01-lot trade in 2026, mostly in the crash. Fills much worse than the tester's ~$0.10 eat that quickly.
- Broker limits. In a crash it opens a new trade every few seconds to minutes.
- Spread. The gold spread in my test data was $0.16 in January 2026 and $0.24-0.36 later. The straddle pays it on every trade.
- Latency. It reacts to every tick, so the delay between the terminal and the broker matters more than it does for Nyao Scalper.
- Idle time. Weeks without a trade are normal. The chart status shows the H1 ATR next to the $34 it needs.
- Gold's price level. $34 and $1 are dollar distances set at a gold price of about $4,500. If gold moves far from that, the same distances describe a different market.
Limitations
- One event. Most of the profit is the January 2026 crash. The next crash may not look like it, and between crashes the EA earns little.
- One year of real ticks, and the defaults were tuned on it.
- No execution delay in the tester. Real fills in a crash will be worse.
- Gold only, and only at gold prices near today's.
Try it
- Download
nyao_straddle.mq5from GitHub, put it in your MetaTrader 5MQL5/Expertsfolder, and compile it in MetaEditor (F7). It uses no DLLs. - Attach it to an XAUUSD M1 chart on a demo hedging account, and load
settings/xauusd-straddle.setin the Inputs tab. - Optionally, add Nyao Scalper's profiles on their own charts in the same account. Each profile has its own magic number.
- Read the README's Nyao Straddle section for every input and every test, and run your own backtests with your broker's costs before trusting any of the numbers above.
Whatever you decide, do your own research: read the code, run your own backtests and forward-test on a demo account before trusting it with real money. Trading CFDs is high-risk, and you are responsible for your own trades.
Nyao Straddle is free and open source under the BSD-3-Clause license, like Nyao Scalper. I don't sell it, so if someone sells it under my name, treat it as a scam. Issues and pull requests are welcome on GitHub.