Nyao Scalper: an open source gold EA that trades with the trend
My MetaTrader 5 Expert Advisor for gold: how it decides when to trade and when to exit, what the backtests say, including the losing years, and the many ideas that didn't make it.
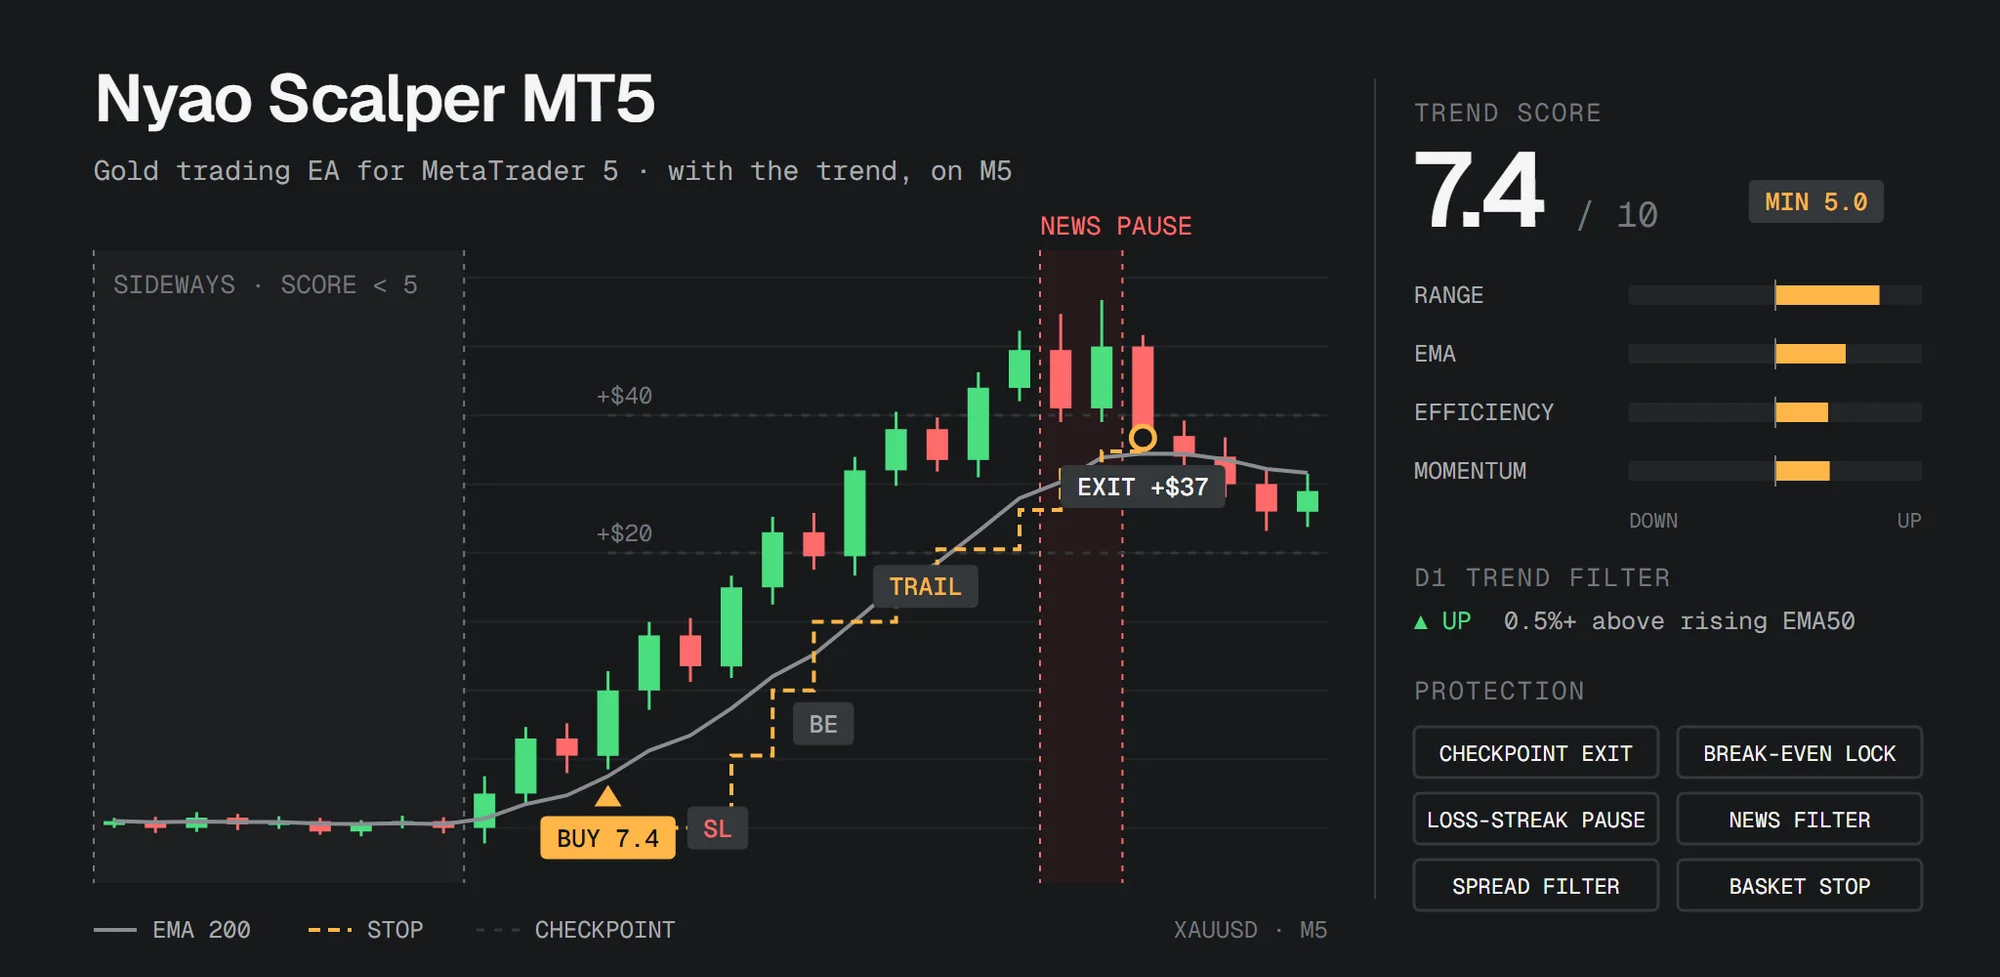
Nyao Scalper is my open source Expert Advisor (EA) for MetaTrader 5. It trades gold (XAUUSD) on the 5-minute chart, only in the direction of the daily trend, and it's built to let the few big trend trades run while keeping the many small losers small. It's named after my cat MaoMao, who says "Nyao!" when he spots a good trade.
- Source code: nyao_scalper_mt5 on GitHub
- Backtest reports: default profile, 2026 and high-risk profile, 2026
Risk warning. Nyao Scalper is an experimental project, and every result below comes from backtests in MetaTrader's Strategy Tester, not from a live account. At most brokers, gold is traded as a CFD (contract for difference) with leverage, so a small price move becomes a large gain or loss, and most retail CFD accounts lose money. Past results don't predict future ones. Nothing in this post is financial advice: do your own research (DYOR), test on a demo account first, and never trade money you can't afford to lose.
This post covers how the EA decides, how it exits, what the tests say (including the years it lost), and the long list of ideas that didn't survive testing. That list taught me more than the ones that did.
The short version
| Result | |
|---|---|
| Strategy | Trend-following on gold, M5 chart, only with the D1 trend |
| Risk per trade | 1.25% of equity at the stop (0.01 lot on $2,000) |
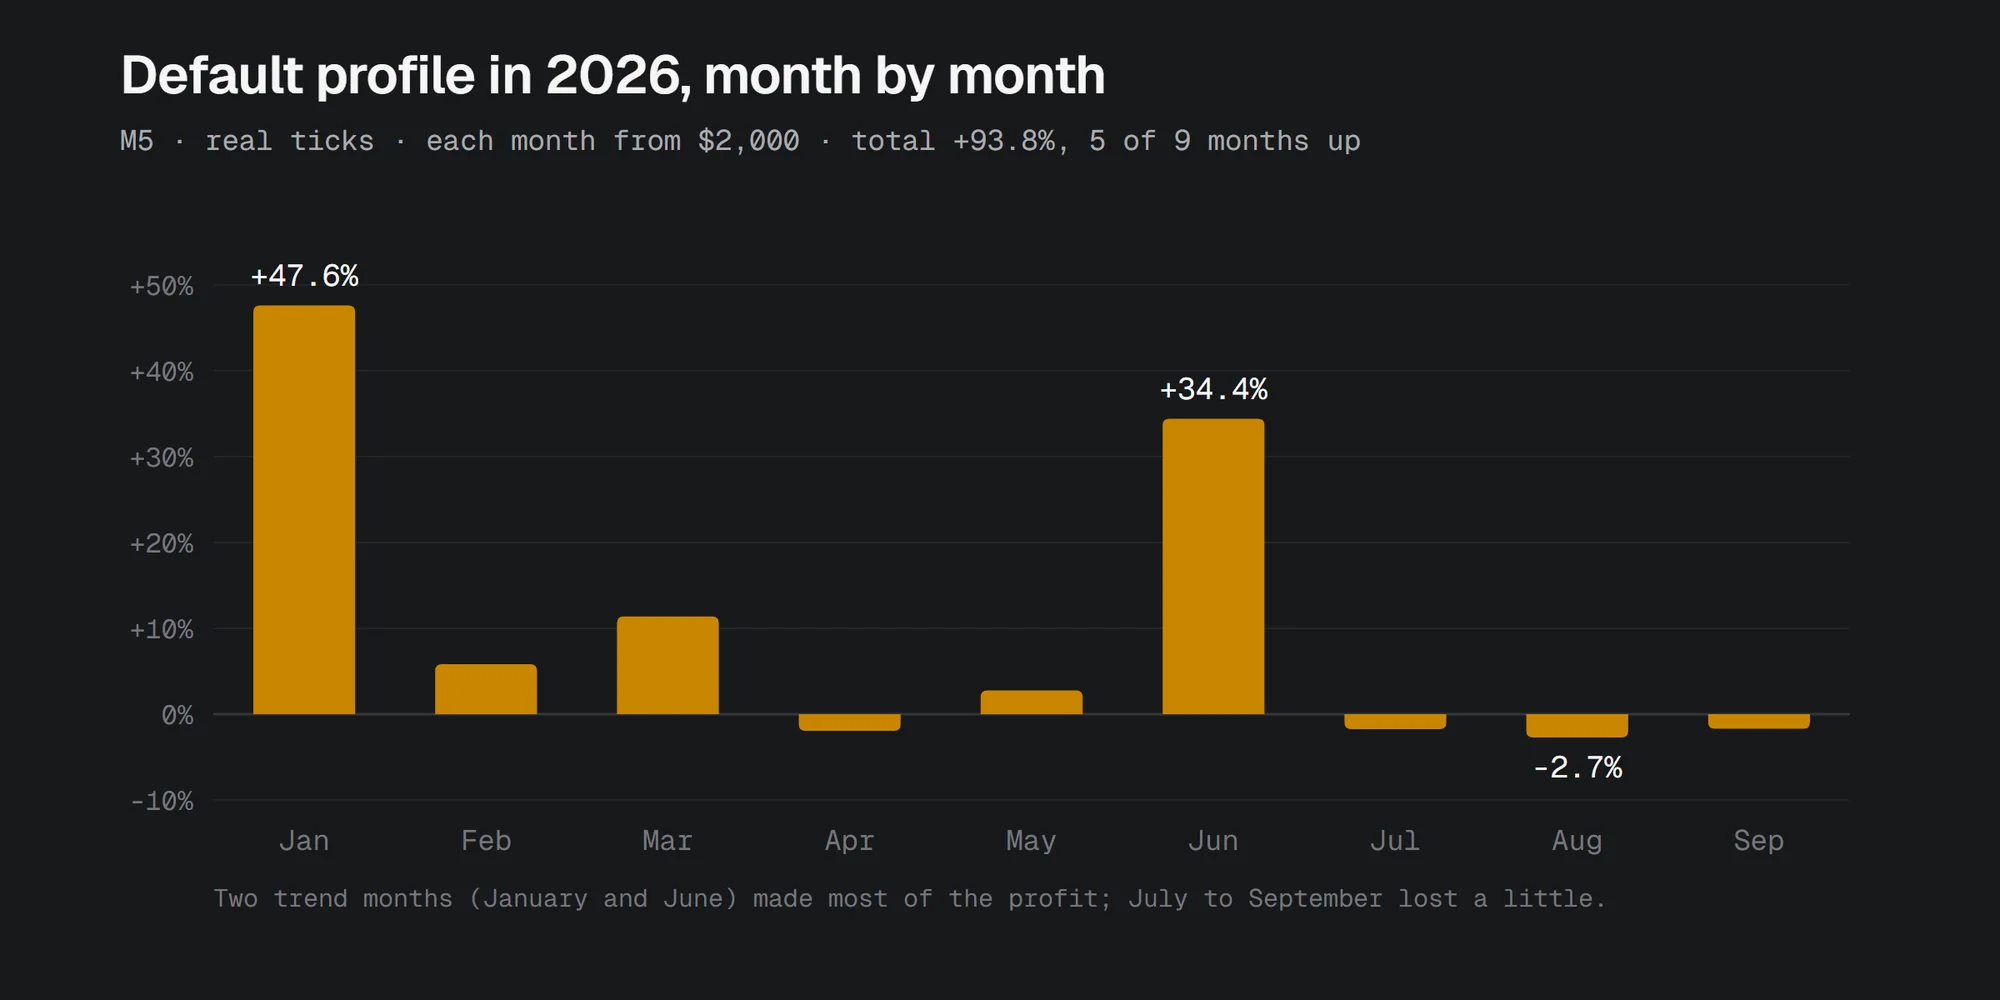
| 2026, Jan-Sep, real ticks | +93.8% (each month from $2,000), worst month -2.7%, max drawdown 19.2% |
| 2022-2026, 57 months | +145.9%, but 2022 and 2023 lost money |
| With USDJPY on the same account | +229.9% over the same 57 months |
It makes its money when gold trends hard, and it gives some back when gold moves sideways. Most of this post is about why.
How it decides to trade
A score from 0 to 10
Every bar, the EA scores both sides from 0 to 10. The score measures how strongly price has trended over the last several hours, from four readings of the closed bars:
| Reading | What it measures | Lookback on M5 |
|---|---|---|
| Range | Where the close sits in the recent high-low range | 200 bars (about 17 hours) |
| EMA | Distance from a slow EMA, measured in ATRs | EMA 200 |
| Efficiency | Net move divided by the total path: a clean trend vs. a whipsaw | 100 bars |
| Momentum | Net move over the lookback, in ATRs | 192 bars |
Each reading runs from -1 (strong down) to +1 (strong up), and the four are averaged into one number, s. The buy score is 5 + 5s and the sell score is 5 - 5s, so the two always add up to 10. A score of 5 means "no trend". The EA buys when the buy score is 5 or more, which simply means the multi-hour trend leans up.
In practice the score rarely sits at 5. On gold M5 from 2022 to 2026, its yearly median was between 4.7 and 5.9 (it follows gold's direction that year), but only about 20% of bars scored between 4 and 6. Most of the time it clearly says up or down.
The EA used to have a different score: a short-term mix of EMA 5/12 crossovers, RSI, candle bodies, breakouts and volatility points. When I measured it properly, it separated winning entries from losing ones about as well as a coin flip (an AUC of 0.51), and it jumped one to three points on tiny price changes. The multi-hour readings carried most of the information, so version 54 removed the old score completely.
Only with the daily trend
A high score isn't enough. The EA only buys while the last daily (D1) close is at least 0.5% above a rising 50-day EMA, and only sells below a falling one. That skips the choppy phases where price hugs the EMA and the trend keeps flipping.
Guards before every entry
Even with a good score and the daily trend agreeing, a trade can still be blocked:
- Position limits: at most 2 positions at a time, at least $15 apart, one per bar, and none while 2 losing trades are open in that direction.
- After losses: a 3-bar cooldown after 3 losses in a row. After 4 in a row, the EA stops opening real trades and paper-trades every signal instead, until a paper trade wins.
- Market conditions: no entries when the spread is above $0.50, from 30 minutes before to 30 minutes after high-impact news, or in the last 30 minutes before the market closes.
- Account protection: a basket stop at 8% floating loss, a hard stop at 12%, a pause when equity is 30% below its peak, and a full stop at $20 equity.
These look like small details, but they matter a lot. In one test I turned the loss filters off and kept everything else. The drawdown became about three times deeper. They carry a big part of the edge.
The on-chart dashboard shows all of this live: both scores with their four readings, and a Ready / Blocked line that names the first thing stopping a trade, like "needs a D1 uptrend" or "2 positions open (max 2)".
How it exits
The stop is a fixed $20 move in the gold price. The take-profit isn't sent to the broker. It becomes a checkpoint every $20:
- At each checkpoint, the EA checks the score again. If it still agrees with the trade, the trade stays open, the stop moves up to lock 50% of the move, and the next checkpoint is $20 further. If the score no longer agrees, the trade closes there.
- From +$10, a trailing stop follows the price $20 behind and never moves back.
- At +$15, the stop jumps to the smallest possible profit, so a trade that got that far ends at about break-even or better. In a fast market the stop can still fill a few cents lower.
- A losing trade is closed early once the opposite score reaches 6, meaning the trend has clearly turned.
For a 0.01 lot trade (1 ounce, so $1 of price is $1 of profit), the stop climbs like this:
| Best profit so far | Stop sits at | Why |
|---|---|---|
| $0 | -$20 | starting stop |
| +$10 | -$10 | the trail starts |
| +$15 | about $0 | the smallest-profit lock |
| +$20 | +$10 | first checkpoint, 50% locked |
| +$40 | +$20 | second checkpoint |
| +$100 | +$80 | the trail, $20 behind |
The design accepts many small losses and a few large wins. In the 2026 tests, the default won 44% of its trades, with an average win of $20.39 against an average loss of $12.84 at 0.01 lot.
What the backtests say
All tests run in MetaTrader 5's Strategy Tester on gold M5. Each month starts from a fresh $2,000, so one bad month doesn't hide the next one, and totals are the sum of the monthly returns. 2026 uses real ticks; for 2022 to 2025 the tester only has ticks generated from 1-minute bars.
2026, month by month
| Jan-Sep 2026, real ticks | Total | Months up | Worst month | Max drawdown | Profit factor |
|---|---|---|---|---|---|
default.set, M5 (1.25% risk) |
+93.8% | 5/9 | -2.7% | 19.2% | 1.23 |
high-risk.set, M5 (2.5% risk) |
+187.6% | 4/9 | -14.4% | 35.5% | 1.21 |
default.set, M1 |
+24.1% | 5/9 | -13.5% | 31.4% | 1.05 |
Two things stand out. Most of the profit came from two trend months, January and June, and July to September lost a little. And M1 does much worse than M5 with the same rules, so the EA is meant for M5.
One continuous run through the same nine months, without the monthly reset, turned $2,000 into $4,135 (+107%) with a 21.9% maximum drawdown.
The longer view, and the losing years
| M5, each month from $2,000 | 2022 | 2023 | 2024 | 2025 | Jan-Sep 2026 | 57 months |
|---|---|---|---|---|---|---|
Gold, default.set |
-5.3% | -9.8% | +1.0% | +66.2% | +93.8% | +145.9% |
Gold went mostly sideways in 2022 and 2023, and the EA lost money in both years. It only shines when gold trends hard, as in 2025 and 2026. If gold goes sideways for a year, expect a losing year.
I should also be honest about one more thing: the current rules were designed on data that includes 2026, so 2026 isn't a blind test.
A partner market: USDJPY
The best improvement I found wasn't a better setting. It was a second market. The same rules also follow USDJPY's trends, and USDJPY tends to trend when gold moves sideways. Their monthly results even move slightly against each other.
The USDJPY profile (usdjpy.set) isn't tuned at all. Every distance is gold's, scaled by USDJPY's daily volatility: a 0.786-yen stop and checkpoint instead of $20, and a 0.309% daily trend distance instead of 0.5%.
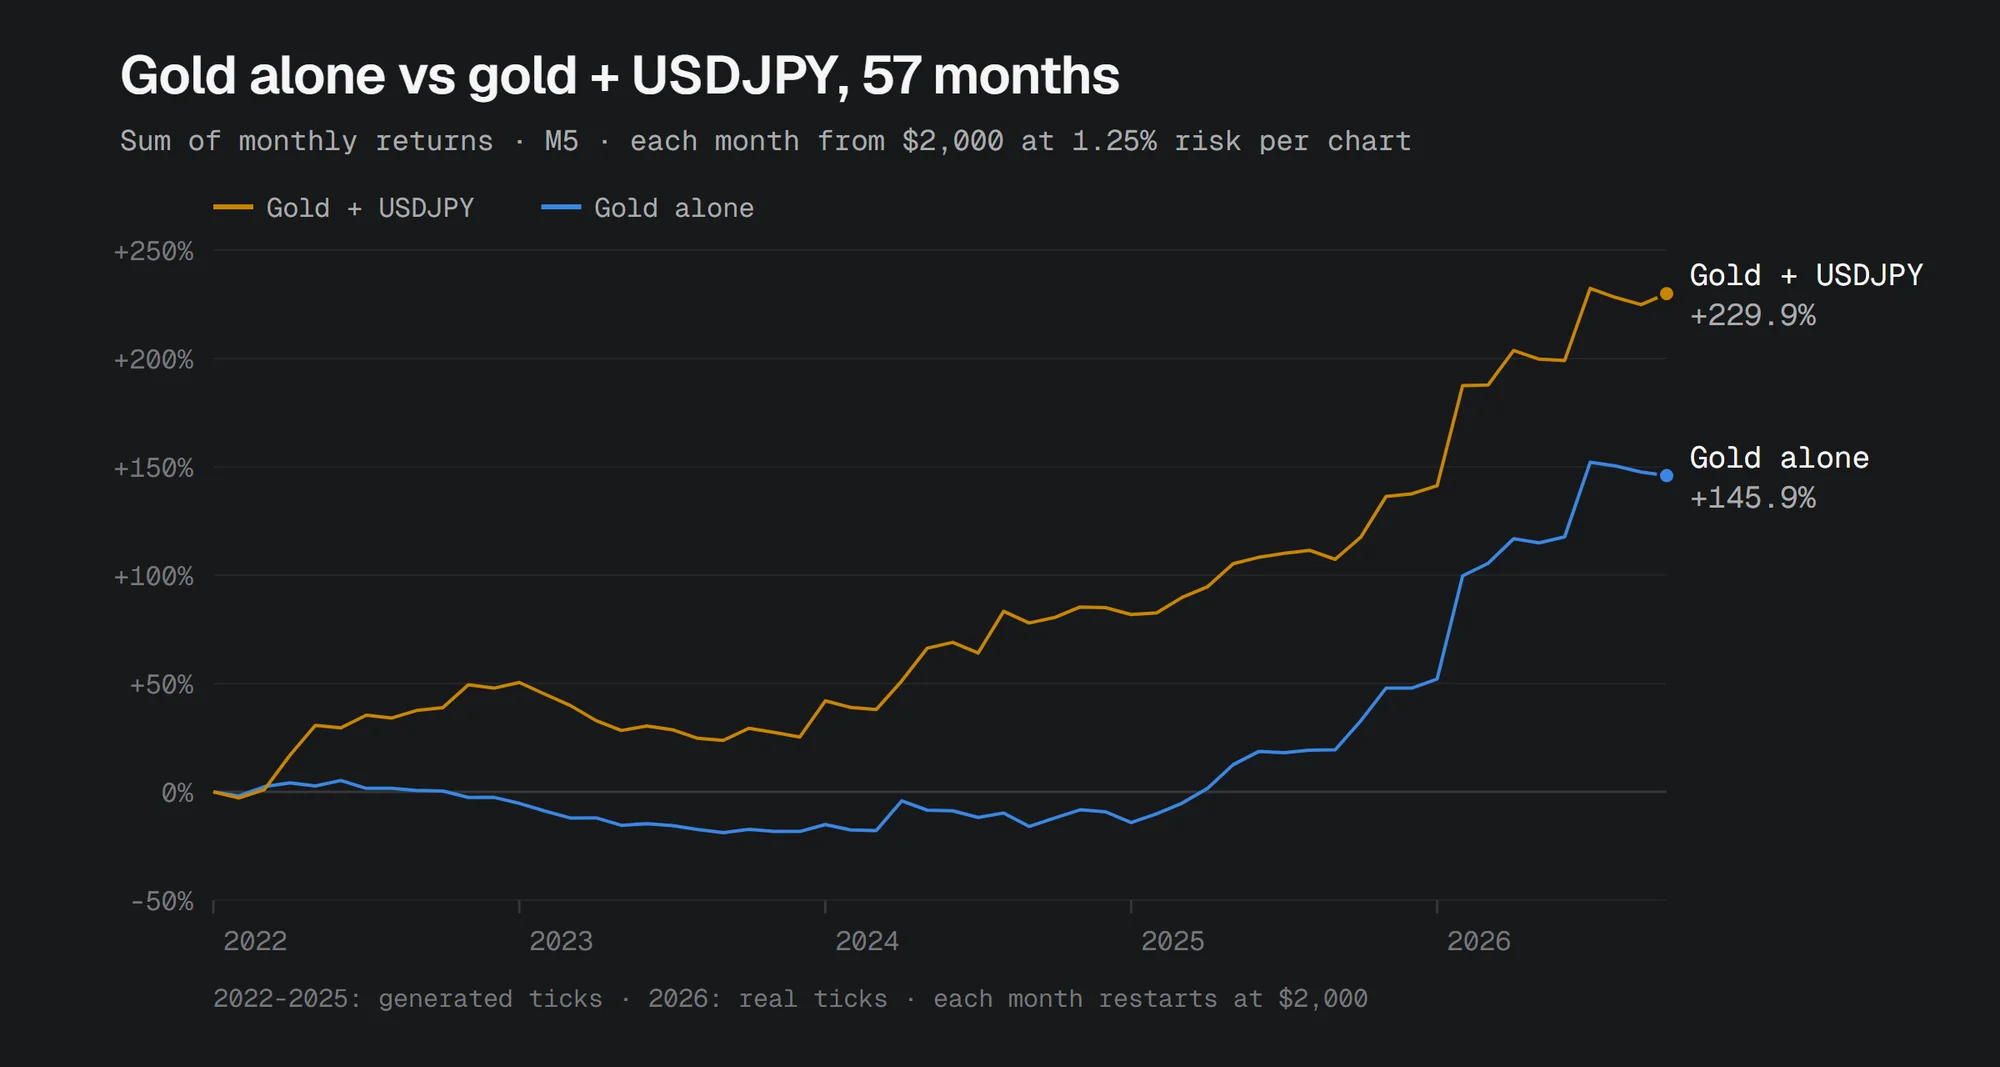
| M5, each month from $2,000 | 2022 | 2023 | 2024 | 2025 | 2026 | 57 months | Drawdown across months |
|---|---|---|---|---|---|---|---|
| Gold | -5.3% | -9.8% | +1.0% | +66.2% | +93.8% | +145.9% | 24.0% |
| USDJPY | +55.8% | +1.3% | +38.9% | -6.8% | -5.2% | +84.0% | 18.8% |
| Both on one account | +50.5% | -8.5% | +39.9% | +59.4% | +88.6% | +229.9% | 26.7% |
On its own, USDJPY is a weak earner: it lost in 2025 and 2026. As a partner it fills gold's flat years, and the combined drawdown stays close to gold's alone.
What didn't work
Nyao Scalper is on its 54th version, and most of the ideas I tested along the way failed. Here is the full list, grouped by what each idea tried to fix. Each row is compared with the default of its day, so numbers from different rows aren't always comparable. Two measures come up a lot:
- Profit/DD: profit divided by the largest drawdown, per 0.01 lot, January to September 2026. Higher is better. The current default scores 5.0.
- AUC: how well a signal separates winning trades from losing ones. 0.50 is a coin flip, 1.0 is perfect.
Trading more often
| Idea | Result |
|---|---|
| Pending-order grids, $0.50 to $2 apart | -160% to -530% over January to June 2026. Most months wiped the account |
| Following the previous candle | Lost on M1, M5 and M15 in every session. The next M1 candle follows the previous one only 49.3% of the time |
| Tiny targets and +$0.10 break-even locks | 80-85% of trades win, but the average win is about $0.60 against $4-5 losses |
| M1 session-open breakouts and Asian-session mean reversion | 10,240 variants, none better than random entries minus the ~$0.30 cost per trade |
| A busy M1 profile, 4 positions $1.50 apart | +133% vs +150% for M5 over 21 months, only 8 months up, 32% drawdown |
| Up to 10 positions, no spacing, fewer filters | +1,238% summed over 2026's months, but one month lost 80% and the drawdown reached 88% |
| 3 positions and a $10 gap | 15% more trades, but the worst month went from -2.7% to -13.3% |
| Adding to winners, up to 4 positions | Profit/DD 3.8. With a basket break-even or basket target: 0.7-2.3 |
| A second gold strategy on M1 or H1 next to M5 | Profit/DD 2.6 (M1) and 3.3 (H1): the strategies move together |
Better entries
| Idea | Result |
|---|---|
| The original 0-10 score | AUC 0.51. Replaced by the trend score, and removed completely in v54.0 |
| A faster, more sensitive trend score | More whipsaw entries. In a walk-forward test the default lookbacks were best in both halves |
| Bigger lots on higher scores | AUC 0.49. Among the trades the EA takes, the score is almost always above 7, so it can't rank them |
| One score for everything, no other filters | Profit/DD 0.8 |
| 16 more entry features (H4 trend, volume, candle size, spread, round numbers and more) | None predicts winners in both test periods (AUC 0.47-0.52) |
| 10 entry attributes (hour, weekday, news time, previous trade, trend age and more) | No loser pattern holds in both sideways and trending years |
| A machine-learning filter, and an AI decision model | AUC 0.49-0.51 |
| Supply/demand zones and fair value gaps | 24 variants, none better than random entries in the trend direction |
| RSI 30/70 and 20/80 zone entries | Lost money without the trend filter, profit/DD 0.2-0.7 with it |
| EMA pullback entries with a 2R target | Win rate 30-33%, profit factor 0.89-0.98 |
| Waiting for a breakout to confirm | +25% vs +83% over 2026: it buys near short-term highs |
| Reversing the signals | January 2026: -$459 vs +$952 per 0.01 lot |
| Not buying near the 24-hour high | Great on paper. In the real EA: +78% to +124% vs +130% over 57 months |
| A stricter daily trend filter (distance, slope) | Doesn't fix the sideways years. The one good setting was an isolated spike |
| A gold/USDJPY cross-market filter | Gold +130% fell to +86-112%, USDJPY +82% fell to +12-14% |
| Trading only the London / New York overlap | -70% vs +22% without the filter (M1, 2026) |
| Raising the minimum score after each loss | Lost 26-46% of the profit |
Better exits
| Idea | Result |
|---|---|
| Stops sized by ATR instead of a fixed $20 | Fewer winning months, 38% drawdown |
| Closing losers that haven't recovered after 3-12 bars | +16% to +71% vs +83% over 2026: many trend trades dip first |
| Cutting losers after 4 hours | Helped in one setup, hurt in another: too fragile to use |
| Bigger profit locks, profit caps, a tighter trail | Higher win rate, but lower profit or a deeper drawdown every time |
| Taking half the profit at the first checkpoint | +131% vs +156% over 57 months, same drawdown |
| Closing everything before the weekend | +126% vs +146% over 57 months |
| A $40 stop with small targets | Profit/DD 3.1. With a trail from +$16: 70% of trades win, but 2.6 times the drawdown |
| No stop loss, trailing only after break-even | 84-95% of trades win, but 2.7 times the drawdown. With the emergency stop also off, two buys were held for 244 days and the account lost 93% |
| Hedging losing trades | Never recovers the loss. The best version only broke even |
Less risk, smaller drawdowns
| Idea | Result |
|---|---|
| Turning the loss filters off | Profit/DD 1.1 |
| Pausing after 2-3 losses in a row instead of 4 | Higher drawdown: the pause skips the trades that recover |
| A daily loss cap | Trades after a losing exit do better than average, so the cap cut profit and raised the drawdown |
| Pausing after a big daily candle | Lower profit, same drawdown |
| Pausing when the last 10-30 trades are net negative | Mixed in 2026, much worse in 2022-2025 |
| Doubling the lot after a win | Lower profit/DD on paper (3.9 vs 4.5) |
| Bigger lots after a drawdown | 2026 +105% vs +83%, but a 38% drawdown vs 20% |
| Halving the risk after a losing 3 months | 43.5% drawdown vs 45.1%: the worst drop came right after the best month, and no trailing rule sees that coming |
| Lots scaled down in volatile markets | Same as a lower risk setting: 82% of the profit with 82% of the drawdown |
| A set tuned on a single month | 2026 +116%, but one month lost 70% and the drawdown reached 87% |
| More than 450 optimizer runs looking for better settings | The best candidate beat the default in 28 of 57 months: a coin flip |
Other markets
USDJPY was the only market that helped. EURUSD, AUDUSD, silver, platinum, oil, the US500, USTEC and US30 indices, and BTC, ETH, XRP and LTC all failed.
What it taught me
Two lessons came up again and again. Taking profit earlier consistently raises the win rate and lowers the profit factor. The edge is in the few trend trades that run to +$60 or +$100, and anything that cuts them costs more than it saves. And the boring loss filters matter more than clever entries. Better entry signals never beat simple rules about when not to trade.
I write down the pass rule before running a test, for example "more profit, and a drawdown no higher than the default". That way a lucky backtest can't talk me into a change.
Account size and risk
The EA sizes each trade from equity: the largest lot that loses at most 1.25% at the $20 stop, capped at 0.05 lot. With gold's $20 stop, 0.01 lot loses $20.
| Equity (standard account) | Lot | Risk per trade |
|---|---|---|
| under $400 | no trades | 0.01 lot would risk more than 5% |
| $400 to $1,600 | 0.01 | 1.25% to 5% (shown in orange on the dashboard) |
| $2,000 | 0.01 | 1.0% |
| $4,000 | 0.02 | 1.0% |
| $8,000 and above | 0.05 (the cap) | 1.25%, then lower |
- Standard account: $2,000 or more is recommended.
- Cent account: $100 or more (10,000 cents) trades 0.05 lot at about 1% per trade.
- Hedging account required. Leverage only changes the margin a trade needs, not what it risks.
- Costs matter. The average 0.01-lot trade nets about $1.67 and pays about $0.26 of spread. Every $0.05 saved per trade adds roughly 3 percentage points per nine months.
The high-risk.set profile uses the same rules at 2.5% per trade: about twice the return and twice the drawdown, not a better strategy.
Testing it yourself
The repository includes a Python tool (tools/backtest/nyao_backtest.py) that runs the Strategy Tester from the command line, one fresh run per month, and writes a report with every run's balance and equity curve. The reports linked at the top came from it.
A few things I learned about honest backtests:
- Use real ticks where you can. Generated ticks are fine for a rough look, but trailing stops and break-even locks behave differently on real data.
- The news filter doesn't work in the tester, so backtests have no news protection. Live trading is a little safer around news than the tests show.
- Swap rates change. Rerunning the same test a day later can differ by a few cents per month, because the tester uses the broker's current overnight swap.
Limitations
- Sideways years lose. 2022 and 2023 lost money, and that will happen again.
- Backtests only. There's no live track record yet, and 2026 was part of the design data.
- Gold-specific. The edge didn't carry over to other markets, except USDJPY as a partner.
- Broker differences. Prices quoted with 2 decimals instead of 3 are rescaled automatically, but spreads, swaps and execution differ from broker to broker.
Try it
- Download
nyao_scalper.mq5from GitHub, put it in your MetaTrader 5MQL5/Expertsfolder, and compile it in MetaEditor (F7). It uses no DLLs. - Attach it to an XAUUSD M5 chart on a demo hedging account, and load
settings/default.setin the Inputs tab. - Optionally, add a USDJPY M5 chart with
settings/usdjpy.set, and set DrawdownScope to "This EA's Own Trades" on the gold chart too. - Read the README for every setting, and run your own backtests with your broker's costs before trusting any of the numbers above.
Whatever you decide, do your own research: read the code, run your own backtests and forward-test on a demo account before trusting it with real money. Trading CFDs is high-risk, and you are responsible for your own trades.
Nyao Scalper is free and open source under the BSD-3-Clause license. I don't sell it, so if someone sells it under my name, treat it as a scam. Issues and pull requests are welcome on GitHub.